Weather Dashboard
The weather data you actually need, nothing more.
The Problem
Weather apps tend to sit at two extremes: a single number with no context, or an overwhelming wall of radar maps, UV indices, and pollen counts. Neither is especially useful when you just need to decide what to wear or whether a plan will hold up over the week.
The Solution
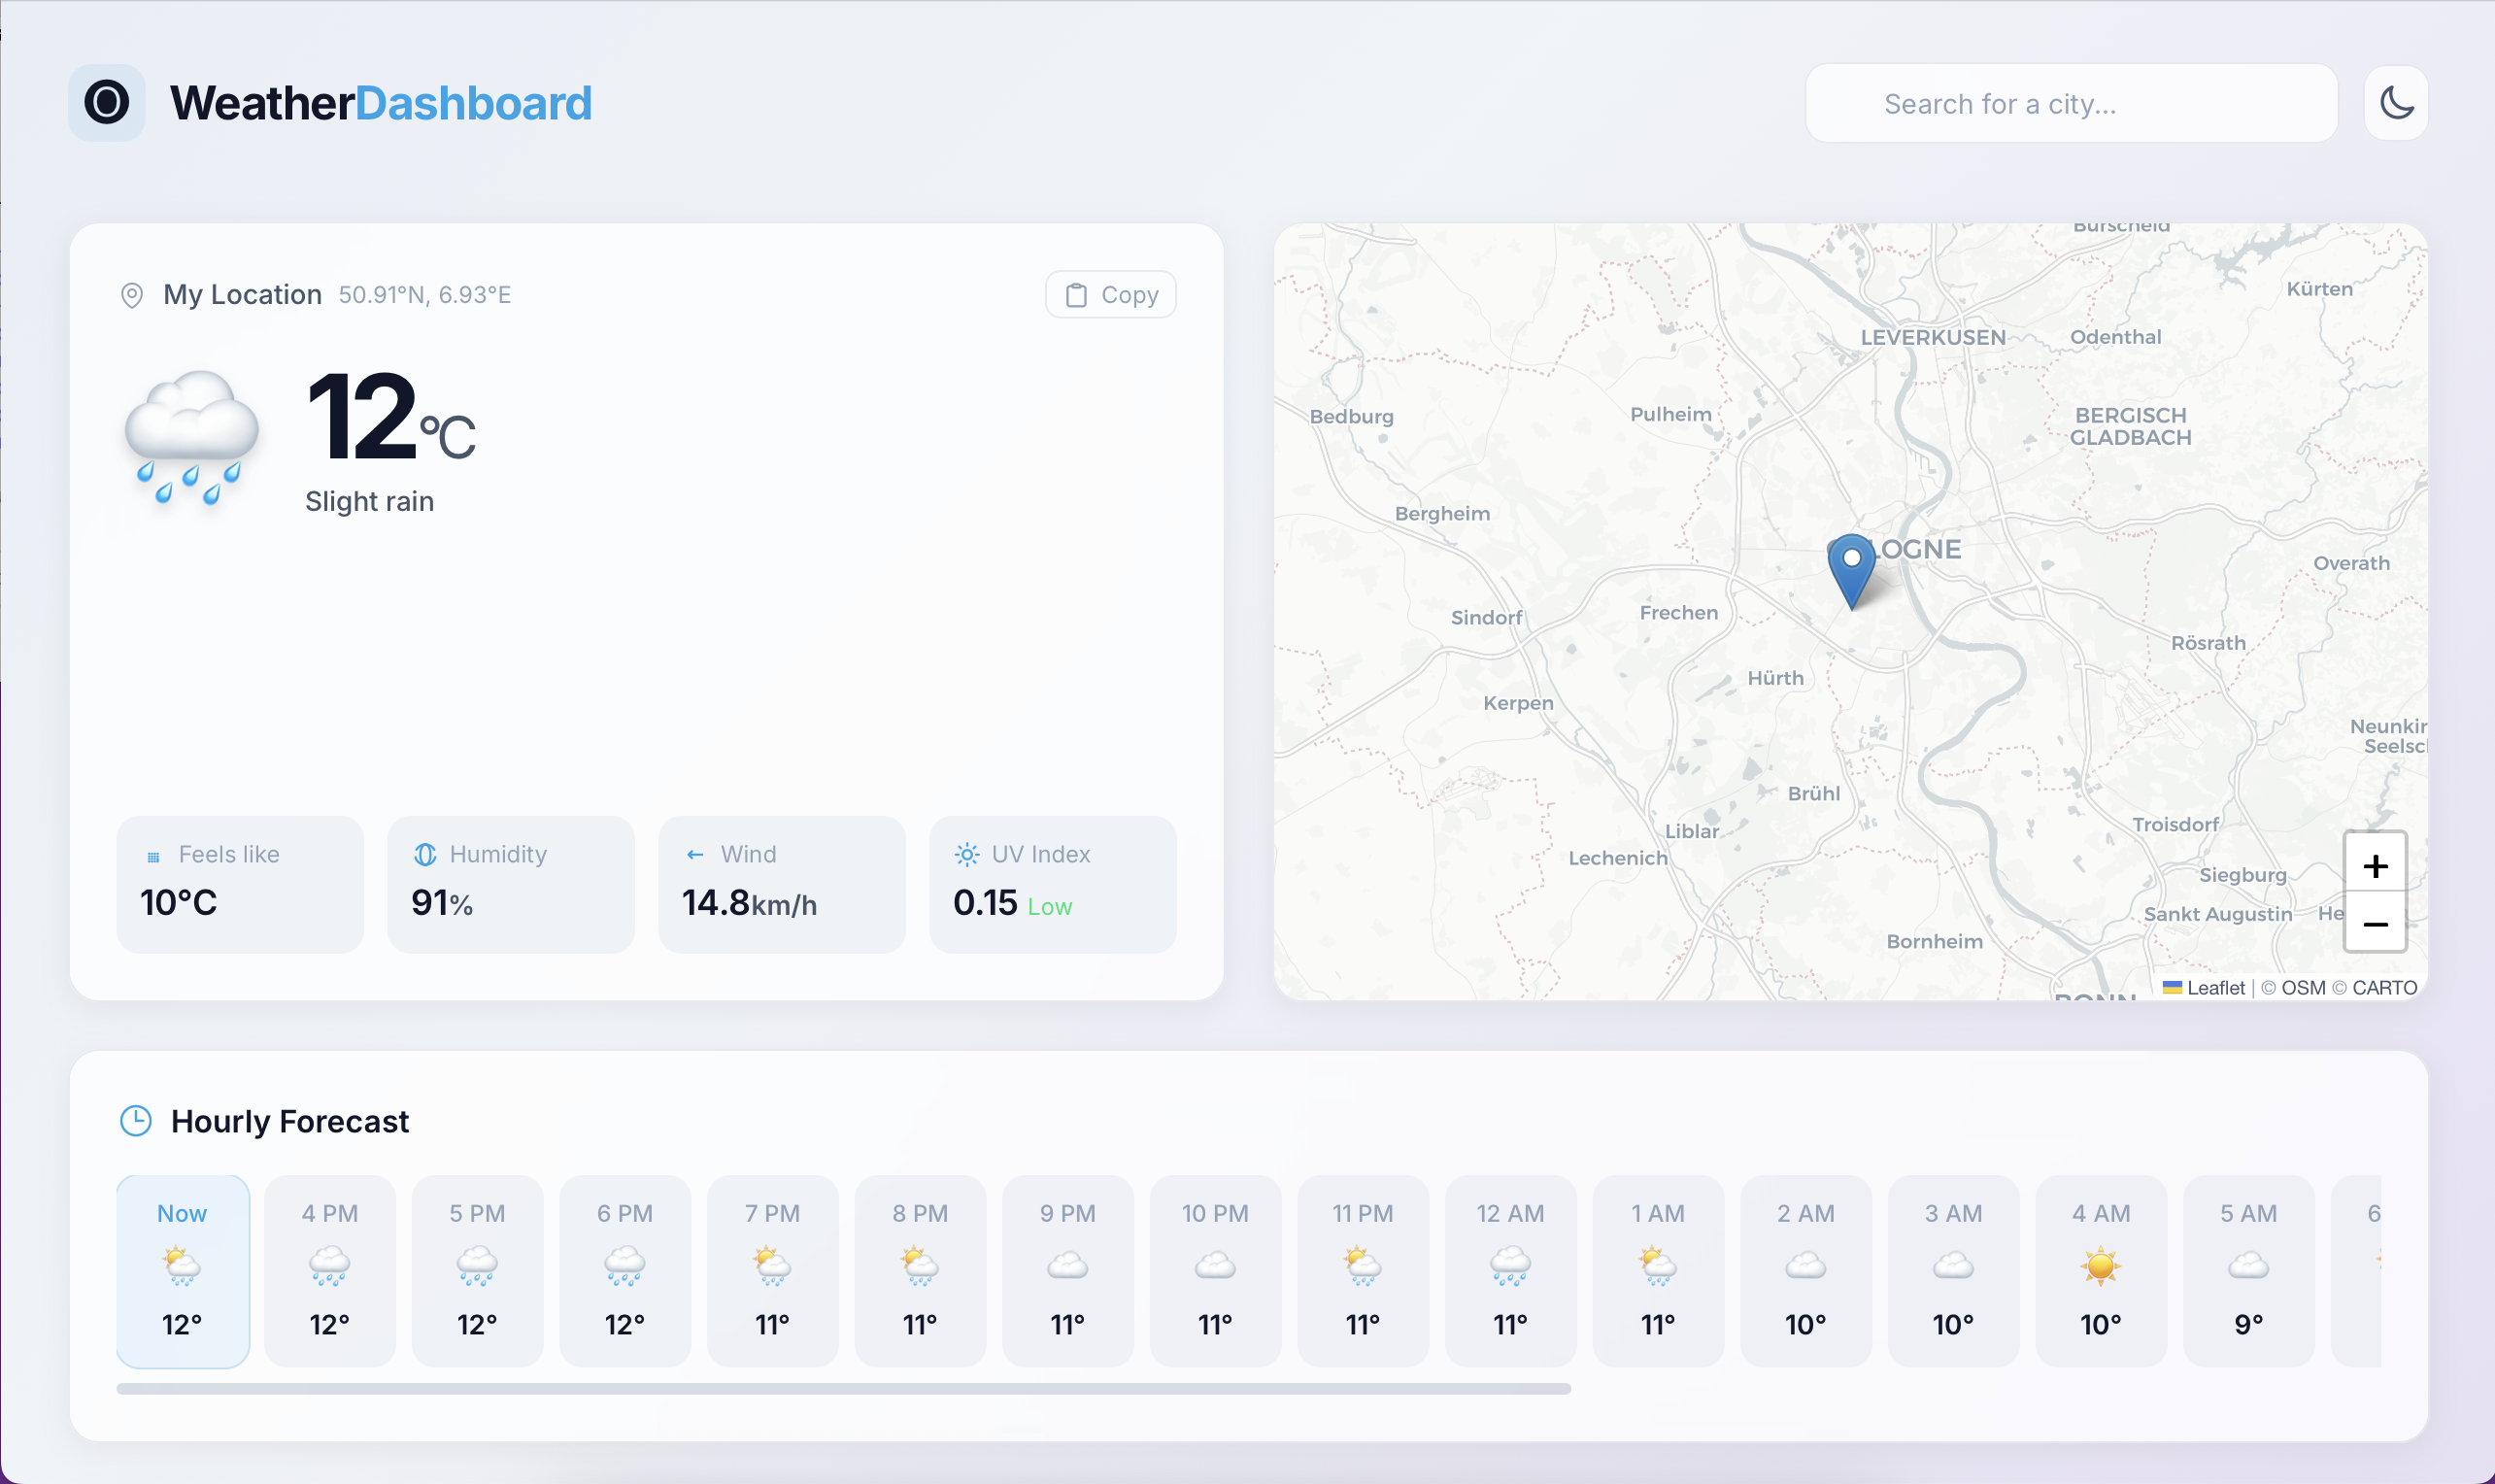
Weather Dashboard surfaces the information that matters for day-to-day decisions — current conditions, an hourly breakdown for the next 12 hours, and a clean 7-day forecast — all on a single page with no navigation required.
7-Day Forecast Visualization
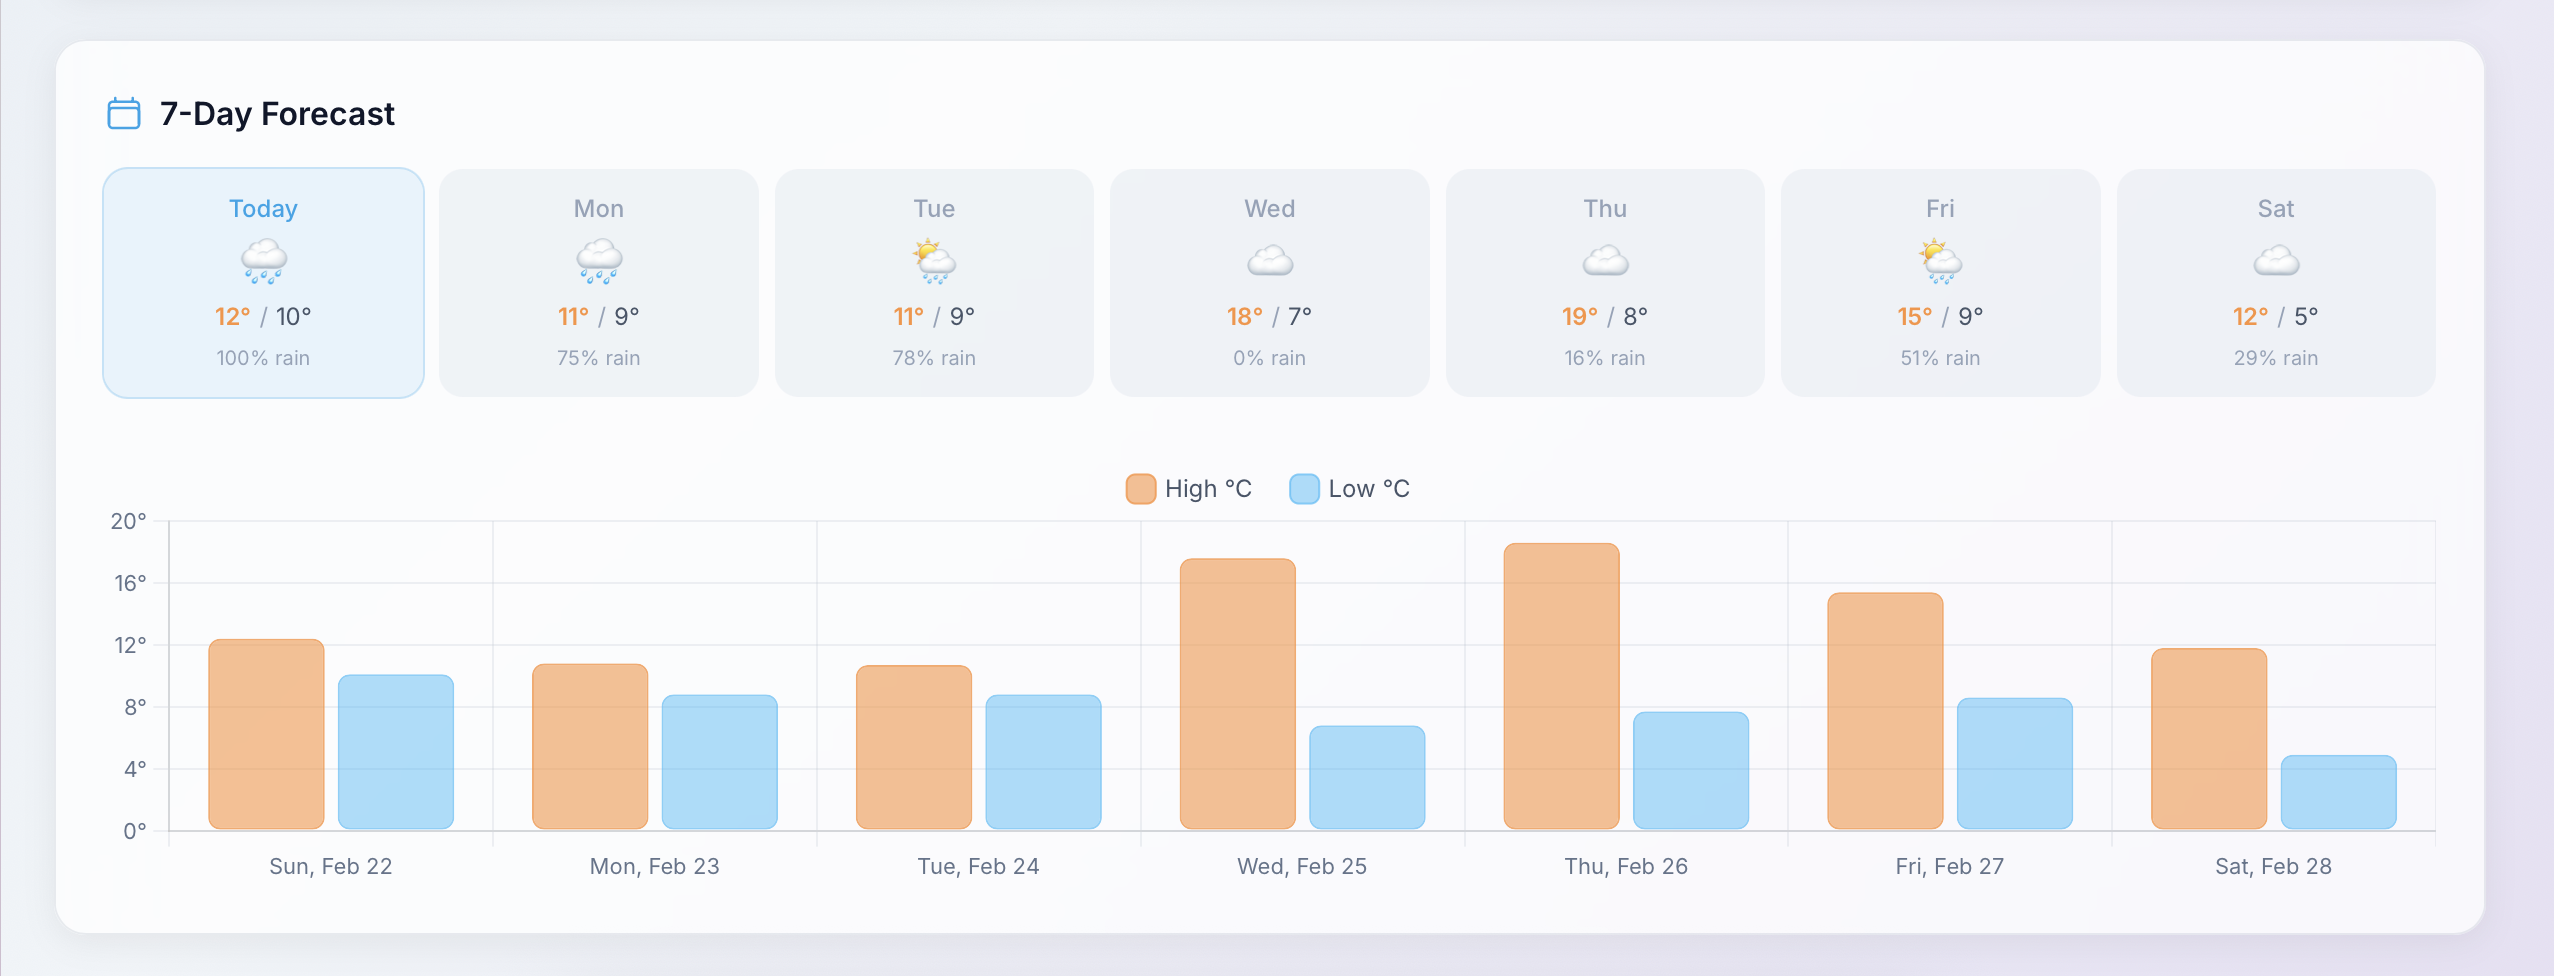
The forecast chart uses a smooth curve to show temperature trends across the week rather than a raw table of numbers. At a glance you can see whether a warm spell is incoming or a cold snap is on the way, making it easier to plan a few days ahead.
Location Search
The search bar accepts city names and returns results instantly via the OpenWeather Geocoding API. The last searched location is persisted in localStorage so the dashboard opens on your city by default on return visits.